Coastal Heritage Magazine
Climate Change and Extreme Weather
Climate change is often functioning as an accelerant, making some natural weather extremes even more dangerous and intense.

Massive Destruction. From its orbit north of the storm, a satellite image shows Hurricane Sandy as it barrels into the U.S. Northeast. The peninsula of Florida can be seen in the upper-right of photograph. Photo by Normal Kurina, NASA.
Climate Change and Extreme Weather
After Hurricane Sandy barreled ashore in October 2012, killing 100 people and causing an estimated $65 billion in damages, politicians and pundits claimed that climate change is contributing to more intense storms and causing greater coastal flooding.
So were they correct?
Global warming is adding heat to the oceans and atmosphere. It’s also increasing evaporation from the oceans, lakes, rivers, and soils. A warmer atmosphere holds more water vapor. In turn, storms, fueled by added heat and water vapor, are intensifying. This so-called “climate shock” has altered normal weather patterns in subtle and profound ways around the world.
It’s not accurate to say that climate change causes any particular record-breaking weather event. Each extreme in weather is caused by many factors.
But human-induced climate change is now one of those factors and sometimes the most important one, according to Donald Wuebbles, a climate scientist at the University of Illinois.
Climate change has become such a powerful influence in the Earth’s climate system that its fingerprints are found from the poles to the equator and throughout the world’s oceans and atmosphere.
“All weather is occurring against the background of a changed climate,” says Wuebbles, a lead author of a January 2013 public-review draft of a federal National Climate Assessment report, the most comprehensive peer-reviewed analysis of global warming in the United States. “A dominant influence on climate is human activity.”

On the Cover. More homes in the future will be vulnerable to rising global sea level and storm surges, including these marshfront structures at Tolers Cove Marina off the Ben Sawyer Blvd. in Mount Pleasant. Photo by Grace Beahm.
Natural weather extremes are still occurring, of course. But climate change increasingly functions as an accelerant—like pouring kerosene on a fire—making some natural extremes even more intense.
“When climate change is added to a natural extreme, their impacts together increase exponentially,” says John Nielsen-Gammon, Texas state climatologist and an atmospheric scientist at Texas A&M University. For instance, a combination of climate change and a natural extreme—La Niña—contributed significantly to the recent devastating drought in Texas, he says.
Consider other evidence of today’s climate disruption. Summertime Arctic sea-ice melt is increasing, glaciers are rapidly melting, and major ice sheets are further destabilizing. Wild species continue to shift their ranges. Soils are losing moisture to evaporation, especially in dry regions, causing more intense droughts. Storm surges are rising and more beaches are eroding. Sea-surface temperatures are increasing, and ocean waters as deep as 2,300 feet are warming.
Not only was 2012 the hottest year on record in the United States, it also brought 11 different disasters that each caused more than $1 billion in damage. Moreover, a continuing drought in the Midwest is on track to become the most expensive natural disaster in U.S. history.
Nor was the rest of the world spared. Intense flooding swamped Bangladesh and the Philippines. Torrential rains hit China. A severe drought struck the African Sahel, a vast semi-arid region south of the Sahara Desert.
Greenhouse gas emissions, meanwhile, have exceeded the highest scenario projected by the 2007 United Nations Intergovernmental Panel on Climate Change (IPCC) assessment. Industrial society is producing more greenhouse-gas pollution than scientists forecasted at the time, largely because China’s coal use has accelerated even faster than anticipated.
Certain categories of disasters—heat waves, heavy precipitation, drought, and storm surges—are most clearly enhanced by climate change. In the end, though, climate change’s disruption has become so integrated in the Earth’s systems that it influences many other weather extremes.
Two decades ago, most climate scientists viewed global warming as a slow, incremental phenomenon with unknown costs and effects to arrive at some point in the future.
Now, though, more scientists are speaking out with a new, uncharacteristic certainty. The Earth’s climate has changed, they say. And this change is making some weather disasters more likely to occur.
Many weather disasters will continue to be shaped by natural variability, according to a special IPCC 2012 report on climate change and extreme weather.
But, in many cases, climate change has an important role, as well.
“A changing climate,” notes the IPCC 2012 report, “leads to changes in the frequency, intensity, spatial extent, duration, and timing of extreme weather and climate events.”
Climate in History
To understand our modern climate disruption, look back about 250 years to a time when technological advances began radically reshaping the world.
In the 18th century, British mining companies sought more powerful machines to pump groundwater out of coal tunnels. At first, they used water wheels for energy but later developed steam engines modified from military cannons.
Coal or wood would be burned to heat water in a boiler until steam reached a high pressure and expanded, driving mechanisms to pump groundwater. The first steam engines, though, were inefficient and costly to operate. So most British industries continued to use the water wheel and horses as the primary sources of power.
By the 1770s, though, the Scotsman James Watt had designed more efficient steam engines, and investors brought his patented machines into production.
These engines provided energy for mines, factories, mills, and plantations. By the 1790s, some South Carolina planters were using steam engines on their estates to mill rice or gin cotton. Steam power allowed planters to process crops faster so they could cultivate more land and make bigger profits. Later, steam engines powered railroad locomotives and ships.
The steam engine and coal combustion launched the Industrial Revolution in Britain. Coalfields were relatively close to centers of British industry, and coal was far cheaper, more plentiful, and more energy efficient than wood and charcoal.
For generations, while the steam engine drove unprecedented economic growth and raised living standards in many regions around the world, coal was easily the world’s dominant fossil-fuel resource.
Oil production, though, got a boost in 1908 when the Ford Motor Company began manufacturing the Model T. It became the first inexpensive car built on assembly lines, and imitators quickly followed suit.
By the 1950s, worldwide oil production finally caught up with coal production, and natural-gas fields were added to the resource mix.

For hundreds of thousands of years, the rising and falling of carbon-dioxide concentrations were intertwined with the rising and falling of global average temperatures. Source: Climate Change Policy, Island Press, 2002.
Today, global industrial society mines and drills for carbon-intensive fossil fuels that it combusts for energy to power engines in our cars and trucks, electrical plants, factories, and farm tractors. About 80% of worldwide energy use and about 90% of U.S. energy use are derived from combusting fossil fuels.
Unfortunately, this combustion produces carbon-dioxide emissions, which rise into the atmosphere and capture a portion of the re-radiated energy of the sun, increasing the temperature of the Earth.
We know that the rapid increase of carbon dioxide in the atmosphere over the past century has been driven by emissions from human activities. Carbon dioxide from combusting fossil fuels or burning forests has a particular isotope signature. This signature allows scientists to tease out background concentrations of carbon dioxide in the atmosphere from industrial society’s contributions.
Atmospheric carbon dioxide is by far the strongest lever of global warming and global cooling. Other greenhouse gases include water vapor, methane, and nitrous oxide.
When the atmospheric concentration of carbon dioxide increases, the planet warms. When it decreases, the planet cools.
Scientists have their most complete understanding of the global climate over the past 800,000 years, primarily from ice-core records that have been confirmed from other sources. That’s a very long time in human history. Our species, Homo sapiens, did not emerge in Africa until about 200,000 years ago.
Along the span of the ice-core record, atmospheric carbon dioxide cycled up and down between about 180 parts per million (ppm) and about 280 ppm.
When atmospheric carbon dioxide dropped near 180 ppm, the Earth’s climate turned very cold and giant ice sheets covered high-latitude landmasses in the Northern Hemisphere. When atmospheric carbon dioxide rose to 280 ppm about 11,500 years ago, world climate was bathed in warm temperatures and glaciers retreated. It remained near 280 ppm for thousands of years until industrial society increasingly burned coal for energy production in the late 18th century.
Today, it’s near 400 ppm—and rising. Over just two centuries, atmospheric carbon dioxide has increased 120 ppm beyond the highest concentration found in the ice-core record.
Even more troubling news is that atmospheric carbon dioxide continues to increase at an “exceptionally fast rate,” noted the 2007 IPCC assessment. It is annually increasing six-times faster than the historical average from 1750 to 2000, and it will soon increase seven times faster and then eight-times faster and then nine-times faster, according to the IPCC.
Looking deeper into the Earth’s distant history, scientists have found epochs when atmospheric carbon dioxide was roughly the same level as it is today.
For example, some 15-to-20 million years ago, atmospheric carbon dioxide was in the 350-to-400 ppm range, notes Aradhna Tripati, a climate scientist at the University of Southern California–Los Angeles. Tripati and her colleagues explained in a 2009 study in the journal Science that global temperatures were 5-to-10° F (3-to-5.5°C) higher than today’s, and sea level was approximately 75-to-120 feet higher.
When the Earth’s atmospheric carbon dioxide increases, global -temperature rises. And that’s what is happening now. As expected by climate scientists, the Earth’s surface temperature is responding sensitively to a dramatic and human-driven change in atmospheric chemistry.
Global temperature data collected on land, at sea, and later by satellite sensors show that average land and sea temperatures have warmed by 1.5° F (0.8° C) from the first decade of the 20th century to the first decade of the 21st century. Most of this warming has occurred since the late 1970s.
This warming will continue to accelerate for decades. On the current track of climate disruption, global temperatures could rise as high as 11° F (6° C) by 2100, according to the IPCC.
A hotter climate eventually drives up global sea level. Thermal expansion has accounted for about four inches of global sea-level rise over the past century. Loss of freshwater from glaciers and ice sheets accounts for the other four inches.
Recent studies, however, indicate that massive polar ice sheets in Greenland appear to be more significant contributors to rising sea level than previously realized because the ice sheets are losing mass so quickly.
There’s no question about the climate’s long-term direction. Each time that the planet warmed, ice sheets have melted. The question now is how much and how fast they will melt.
Global sea level is expected to rise about two-to-four feet by 2100, according to the public-review draft of the federal National Climate Assessment report, though regional and local impacts will continue to be widely variable.
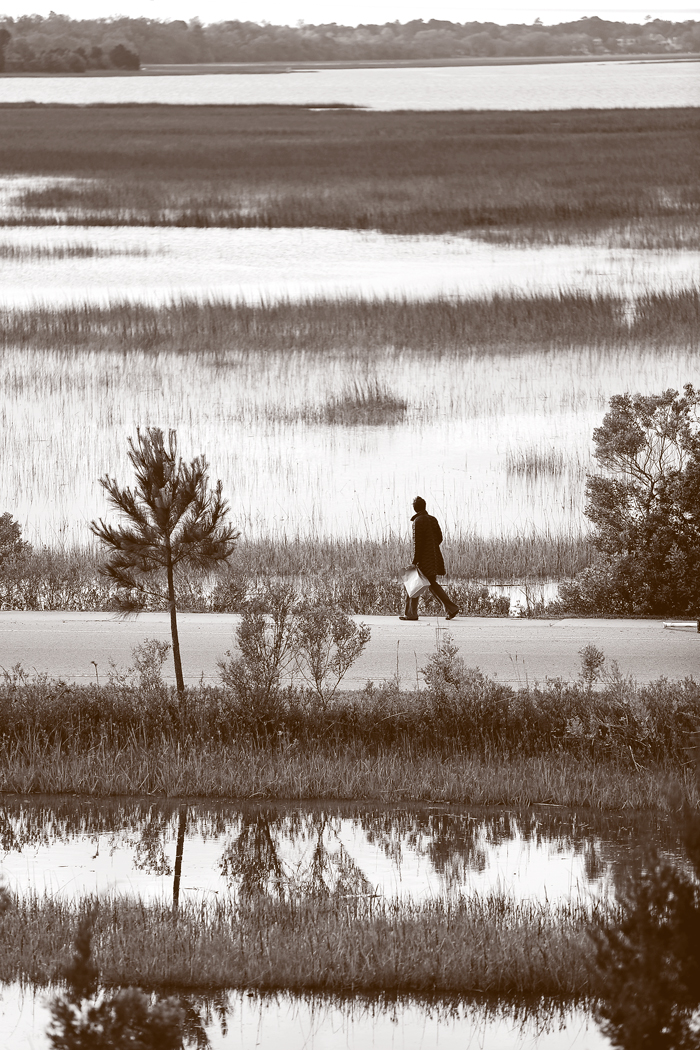
Matter of Time. A man walks along the off ramp of Highway 61 going to West Ashley, where highways 17 and 61 split. High tide sometimes covers the road. Global sea level is expected to rise two-to-four feet by 2100, swamping many of today’s roads and causeways. Photo by Grace Beahm.
A sea-level rise of about three feet by 2100 is the “slow, small, and expected” scenario that some policymakers are starting to include in planning, says Richard Alley, a climate scientist at Pennsylvania State University. But “we can’t rule out catastrophic change” of 15-to-20 feet of sea-level rise by 2100. It’s not likely to occur, he says, but scientists can’t eliminate it as a possibility, either.
Listening to the Orbits
The Earth’s climate oscillates between cold eras—popularly known as ice ages—and the warm eras known as interglacials.
Ice ages usually last about 100,000 years, and the interglacials about 10,000 years, though some have lasted 5,000 and others 20,000 years. The most recent ice age ended about 11,500 years ago. Today, we are living in an interglacial period called the Holocene.
Periodic wobbles in the Earth’s orbit around the sun have had the leading role in driving past major climate changes.
About 20,000 years ago, an orbital wobble allowed slightly more direct sunlight to warm the icy high-latitude regions of the Northern Hemisphere. Ice sheets at that time covered nearly a third of the world’s landmass. In North America, they covered all of Canada and reached as far south as New York City.
Ice and snow reflect solar radiation, bouncing a portion of the sun’s heat back into space and allowing the Earth to stay relatively cool. But when more direct summer sunlight touched northern Canada 20,000 years ago, portions of the ice sheet there began to melt. As a result, muddy ground, shallow lakes, and wetlands appeared, soaking up more heat.
During this long, slow melt, organic matter—roots, leaves, and aquatic plants—that had been frozen for tens of thousands of years began to rot.
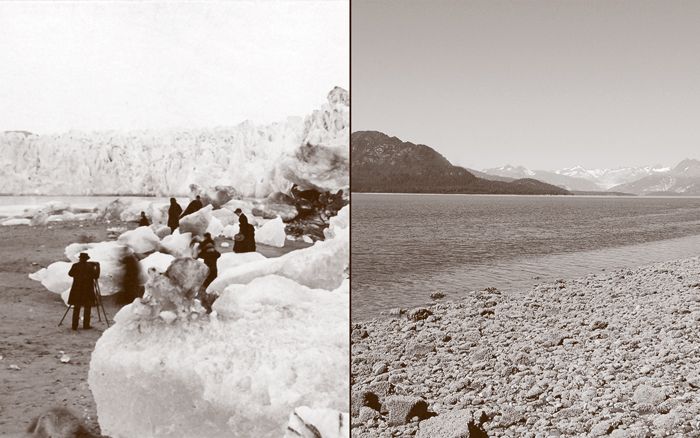
Bygone Era. In 1882, G.D. Hazard photographed the Muir Glacier (left) in Alaska. The same location was photographed in 2005 by Bruce F. Molnia. Photos: Glacier Photograph Collection, National Snow and Ice Data Center, World Data Center for Glaciology.
Decaying organic material released carbon dioxide and methane into the atmosphere, which in turn trapped more heat energy from the sun, which in turn further thawed northern Canada ice sheets, which stimulated decay of more organic matter, which released additional carbon and methane—a classic case of a feedback loop.
From this northern Canada feedback loop emerged an immensely complex series of climatic changes, particularly in the oceans where vast volumes of carbon dioxide were released into the atmosphere. This ocean-to-atmosphere transfer of carbon dioxide drove a global warming that lasted almost 10,000 years—until the Earth emerged into the current Holocene interglacial.
It all began, though, with that wobble in the Earth’s orbit.
“Everything is listening to the orbits,” says Alley. The Earth’s most sensitive listening post has been northern Canada. “When ice grows in Canada,” says Alley, “the whole world gets colder. When ice melts in Canada, the whole world melts.”
Today, high-latitude landmasses of the Northern Hemisphere, including northern Canada, are warming faster than any other terrestrial areas on Earth. But this time the Earth’s orbit is not solely in charge. The Earth’s climate now has another powerful master: industrial society and its greenhouse-gas emissions.
The Long Sweat
Broiling high noon—August in South Carolina. Your body responds to higher temperatures by pumping moisture to your skin’s surface. As sweat evaporates from your skin, it changes from a liquid to a vapor, a process that cools you off. As afternoon temperature rises, your body perspires even more. By mid-afternoon, your skin is as wet and slippery as a seal’s.
That’s how your body regulates its heat—by delivering moisture to your skin’s surface where it evaporates and cools.
The Earth’s surface has a similar cooling process. The world’s oceans cover more than two-thirds of the Earth’s surface, absorbing more than 90% of the heat energy captured by greenhouse gases. As daytime temperatures soar, oceans release more moisture into the atmosphere to cool the surface. As the Earth’s surface temperature has increased over decades because of climate change, evaporation has also intensified, drawing more water vapor into the atmosphere.
Because of climate change since the 1970s, there has been a 4% increase in global water vapor, a powerful greenhouse gas.
Intensifying evaporation also robs moisture from surface soils, parching landscapes and causing devastating droughts and wildfires. Longer and deeper droughts have occurred over wider areas worldwide since the 1970s, especially in the tropics and subtropics, according to the IPCC.
Meanwhile, atmospheric currents and winds are redistributing water vapor from water-poor regions to water-rich regions where this moisture is released as rain or snow in heavier storms.
A warming climate, then, increases the likelihood of extremes in precipitation: drought (where it doesn’t rain) and floods (where it rains a lot) but in different places and at different times.

Torrential. Danny Moore struggles through the flood on King and Huger streets on peninsular Charleston as heavy rains stopped traffic on August 28, 2012. The warmer global atmosphere holds more water vapor, which is released in heavier downpours. Photo by Grace Beahm, The Post and Courier.
It’s also raining harder when it finally does rain, even in some dry places. Because a warmer atmosphere holds more water vapor, it is more available to low-pressure systems when they roll in, resulting in more violent downpours. Heavier rains run quickly off surfaces into waterways instead of filtering into soils and recharging groundwater.
Some North American lakes, meanwhile, are shrinking because of increased evaporation. Until recently, parts of South Carolina, especially the upstate, experienced a severe, near-decade-long drought, which drove water levels at some lakes to record lows.
“We have avoided a major water crisis,” says Hope Mizzell, the South Carolina state climatologist. “But there is growing demand for the resource. There are many more of us now, and a lot more stress on the system.”
The ocean and atmosphere are tightly coupled. Together they produce ocean waves, trade winds, storm surges, ocean currents, upper-atmospheric currents, land-sea breezes, tropical cyclones, monsoons, and many other phenomena. The Earth’s water-pumping systems are also tightly integrated with its heat-pumping systems.
So all are interwoven: ocean, atmosphere, soils, global heat, global water vapor, carbon dioxide. Pull one thread and it affects many others.
“We’re changing the environment — it’s very clear,” Thomas R. Knutson, a research meteorologist with the National Oceanic and Atmospheric Administration’s Geophysical Fluid Dynamics Laboratory, has said. “We’re changing global temperature, we’re changing atmospheric moisture, we’re changing a lot of things. Humans are running this experiment, and we’re not quite sure how it’s going to turn out.”
Oscillations and Extremes
Climate change over time is heading in just one direction—toward more warming. But natural climate oscillations—well, they oscillate.
There are several major climate cycles that powerfully influence U.S. weather, including the El Niño-Southern Oscillation (ENSO), the North Atlantic Oscillation, and the Madden-Julian Oscillation.
ENSO, perhaps the best known of these cycles, is a phenomenon of the Pacific Ocean and atmosphere that causes dramatic weather extremes around the world, including droughts, wildfires, and Atlantic hurricanes.
ENSO is perhaps the Earth’s most powerful agent of extreme weather.
There are two components of ENSO. El Niño—or “the little boy” in Spanish—occurs every three to seven years when easterly trade winds fall off and unusually warm, low-pressure systems get trapped in the central equatorial Pacific Ocean.
As this stretch of ocean simmers, huge columns of heat and water vapor are drawn up into the atmosphere, spawning thunderstorms and tropical cyclones.
In turn, these pistons of moist heat are driven upward into the cold winds that race easterly across the dome of the world. It is El Niño’s pressure that shoves the jet stream into a higher gear, doubling its speed. Thousands of miles away, a faster and more powerful jet stream chops off the heads of giant Atlantic Ocean thunderclouds, hurricanes-in-making, that form off the west coast of Africa in a process called “vertical shear.”
That might be a bit of consoling news for South Carolinians. If global warming over this century strongly enhances El Niño and other ocean-atmosphere oscillations, it could make Atlantic hurricanes less likely to occur.
But Atlantic hurricanes that do manage to form will be more likely to be intense ones. That’s because warmer North Atlantic water—if every other factor is equal—energizes hurricanes. The warmer the Atlantic, the stronger a hurricane becomes. Indeed, climate models indicate that Atlantic hurricanes are likely to be more intense but less frequent over the 21st century.
La Niña (“the little girl”) is the other half of ENSO, but it occurs only about half as often. A La Niña event begins when colder than normal sea-surface temperatures arrive in the central equatorial Pacific Ocean, and increased atmospheric moisture moves into the western Pacific.
La Niña, which also strongly affects the world’s atmospheric currents, has a powerful influence on North American weather, pushing easterly storm tracks and moisture farther north than usual.

In 2010-2011, an especially strong La Niña contributed to intense droughts along the southern tier of states from southern California to the Carolinas. Source: International Research Institute.
In the United States, this diverting of water vapor and low-pressure systems typically causes droughts through the Sun Belt from Southern California and Arizona across to South Carolina.
It was a combination of global warming and a strong La Niña event that combined to create a record-setting drought and heat wave in Texas in 2010-2011, according to John Nielsen-Gammon, the Texas state climatologist.
This kind of double whammy—climate change teaming up with natural extremes—is a troubling model for the future, notes Kevin E. Trenberth, a senior scientist with the National Center for Atmospheric Research in Boulder, Colorado, and a lead author of the 2007 IPCC assessment.
When natural climatic extremes and global warming synchronize in the same direction, they shatter weather records, Trenberth writes in the journal Climatic Change.
In contrast, when a natural extreme and climate change are going in opposite directions, they can cancel out one another, resulting in mild or uneventful weather. As a result, climate change can be masked for years. People tend to let their guard down, thinking that climate change has lost momentum. Eventually, though, natural climatic extremes and global warming will synchronize, and weather records will be shattered once more.
Sandy and Sea Level
Is Sandy, after all, the harbinger of future storms and coastal flooding in a warmer climate?
Sandy was the largest Atlantic hurricane on record in geographic terms, spanning 1,100 miles. It was also the second-most expensive hurricane in U.S. history, trailing only Katrina in 2005. And Sandy was freakishly powerful for an autumn storm striking the U.S. Northeast, teaming up with another dangerous weather system to make a rare “superstorm.”
But giant hurricanes do occur naturally, of course—and they have periodically hit the U.S. Northeast. So how much did our changing climate affect Hurricane Sandy’s power and destruction?
Since the 1970s, climate change has established new baseline conditions of increased atmospheric water vapor and higher North Atlantic Ocean sea-surface temperatures. These baseline conditions likely enhanced Sandy’s size and intensity, scientists say—but the extent of that enhancement is still debated.
Global sea level has risen over the past century, which affected Sandy’s destructive energy across coastlines. There’s no debate about that. Sandy’s highest surge of 14 feet crashed into lower Manhattan near a water-level monitoring station that has recorded about one foot of sea-level rise since 1900.
One-third of that rise—about four inches—has been caused by natural land subsidence since the early 20th century. Coastal land continues to sink because gravity is packing ancient delta sediments tighter and tighter.
But global warming, by melting ice sheets and expanding seawater, has caused the other two-thirds of global sea-level rise—or about eight inches. Satellite observations, moreover, point to an apparent increase in the rate of global sea-level rise since the 1990s.

Satellite data show that global sea level rise has accelerated since the early 1990s. Graphic: Neil White, CSIRO
Scientists have found that even “small increases in sea level over the past few decades already have increased the height of storm and wind-waves” in many U.S. coastal regions, notes a December 2012 report published by the NOAA Climate Program Office.
So how high should we build new structures to accommodate sea-level rise?
In 2010, the North Carolina Coastal Resources Commission’s Science Panel on Coastal Hazards recommended that the commission begin planning for a target of three feet of sea-level rise by the year 2100.
But that might not be realistic because “almost no one plans for events 90 years into the future,” notes Spencer Rogers, a coastal construction and erosion specialist with the North Carolina Sea Grant program, in a July 12, 2012 advisory letter.
It’s more feasible for households to plan over a shorter-term—30 years. In North Carolina, a 30-year timeframe for a household could bring an estimated eight inches of sea-level rise by 2040, taking into account historical data and a potential acceleration by climate warming.
“If you’re a homeowner or a small-business owner, 30 years is a reasonable amount of time to plan,” says Jessica Whitehead, regional climate extension specialist with North Carolina and South Carolina Sea Grant programs. “It’s difficult for individuals to think much beyond that.”
Thirty years is the length of a typical home mortgage. So when building a home along the coast or retrofitting an older one, it would be wise to remember that three decades in the future sea level would likely be several inches higher, depending on many factors.
Some communities stipulate that the first elevated floor of any new or substantially rebuilt coastal home must be built a foot higher than the minimum required elevation in the local flood regulations. That higher elevation above the requirement is called “freeboard.”
Since March of 2012, for instance, the North Carolina Residential Building Code amendments have required one foot of freeboard for all new houses in the state.
Adding more than one foot of freeboard could be a good idea, depending on the structure’s location. After Hurricane Ike struck the low-elevation Bolivar Peninsula along the Texas coast in September 2008, researchers found that surviving homes typically had habitable first floors two-to-four feet higher than minimum floodplain requirements, according to Rogers.
Governments, unlike households, have to look further ahead than 30 years. Policymakers around the country are planning to build or retrofit many roads, bridges, airports, sewage-treatment plants, and railroad infrastructure—all of which tend to be 50-year investments.

Prepared. These elevated homes under construction are located at the Hunley Waters development on Hunley Waters Circle near Park Circle in North Charleston. Photo by Grace Beahm.
Although global sea level will continue to rise, no one can say how rapidly it will do so over the next half-century. Moreover, each coastal location is unique. Some shorelines are already eroding rapidly; others have widening beachfronts.
“We have and will continue to see different rates of sea-level rise in different places,” says S.C. Sea Grant researcher Paul Gayes, a marine scientist and director of the Center for Marine and Wetland Studies at Coastal Carolina University. “Global change doesn’t mean that everybody gets the same experience nor necessarily at the same time.”
Polls taken after Sandy show that the public increasingly recognizes climate change as a driver of more extreme weather events and coastal floods. Residents of the densely populated U.S. Northeast, especially New York City, the nation’s cultural and economic capital, are talking about climate change in a new way.
In July 2013, Mayor Michael Bloomberg unveiled a $20 billion plan to protect New York City from future floods associated with climate change. The plan includes 250 recommendations ranging from new floodwalls and storm-surge barriers to flood-proofing the city’s power and telecommunications infrastructure.
“Superstorm Sandy has been a game-changer,” says James McCarthy, an oceanographer at Harvard University. “It has connected the dots to a lot of people. That a hurricane could come up the East Coast and continue to intensify in near-record warm temperatures over the past 100 years enabled people to imagine a future of more intense storms.”
New Flood Maps and Premium Changes Coming
Many owners of older, low-elevation structures in South Carolina could face sticker shock when they see their flood-insurance bills over the next several years.
After numerous major hurricanes and other disasters over the past decade, the federal flood-insurance program was swimming in red ink. On July 6, 2012, a new law passed by Congress made significant reforms to the program, including eventual elimination of all subsidies.
The National Flood Insurance Program (NFIP) will roll out new preliminary flood-risk maps in communities around the country over the next year. These maps will provide information to be used by NFIP to update insurance policies.
New homes and other structures in flood-risk areas already must be elevated on pilings or by other means to meet NFIP requirements. Elevating the first habitable floor of a structure is a cost-effective way to avoid destructive floods.
But thousands of structures built decades ago were grandfathered into the program and given low-cost insurance premiums without an elevation requirement.
“We saw this problem during Hurricane Sandy,” says Thomas J. McGuire, the floodplain management coordinator for Charleston County. “There were a lot of homes in older, developed areas on Staten Island and other places that predated [the federal flood insurance rules], and they weren’t elevated. They didn’t have proper foundation systems, and many property owners thought they were not susceptible to coastal flooding.”
Subsidies are being phased out for second homes, rental houses, and commercial properties that were not raised on pilings or new foundations and were built before the federal flood-insurance program came into effect in 1968. Subsidies for severe repetitive-loss properties will be phased out later in 2013.
By late 2014, all subsidies are supposed to go away, but they would not go into effect right away for some homeowners, according to Maria Lamm, the NFIP coordinator for South Carolina.
Many properties covered by existing subsidies would continue to be charged lower rates until they are sold or if policies are allowed to lapse. (Check with your insurance agent. The Federal Emergency Management Agency runs the program, but private insurers administer policies.)
Premiums for low-elevation structures in vulnerable locations would get signficantly more expensive. Think of an older home built on a slab not far from the beachfront with coverage of $250,000 on the structure and $100,000 on the contents. Let’s say that the first inhabited floor is three feet under the designated “base-flood elevation” in a high-risk VE zone.
The owner of this building would eventually face an annual premium of $18,354, according to Spencer Rogers, a coastal construction and erosion specialist with the North Carolina Sea Grant program. That would be an increase of 142% over the previous premium of $7,454.
Rate increases, however, would be limited to 25% annually until the accurate flood-risk premium is reached.
The 2012 law will change premiums on many structures far inland.
Steroids and Carbon Dioxide—the Wisdom of Metaphor
Americans like sports metaphors.
“That’s a slam dunk.”
“You need to step-up to the plate.”
“They’re playing hardball.”
Metaphors are colorful and vivid, helping us find threads of meaning in a confusing world. When we use a metaphor, we try to translate an abstract idea into something familiar, concrete, and dynamic. Sports metaphors are especially powerful because they clearly express action when there seems to be so little.
Climate scientists have long used metaphors to describe global warming. The term “greenhouse effect” helps us visualize how the atmosphere captures a portion of the sun’s energy. Carbon dioxide, in turn, is called a “greenhouse gas.”
These metaphors are effective cognitive aids, allowing us to visualize a process that can’t be seen directly by the naked eye. But metaphors can mislead and over-simplify. So their potential effectiveness must be balanced against their potential for misuse.
These days, scientists and science journalists are using a sports metaphor to explain how global warming enhances the likelihood of weather-related disasters.
Carbon dioxide is one of the “steroids of heat-trapping gases” that increase global warming, according to a January 2013 public-review draft of a federal National Climate Assessment report to be finalized in late 2013.
In March 2013, members of an Australian government commission called on to address climate change and adaptation said that the nation should begin preparations for a “climate on steroids.”

Atmospheric carbon dioxide at Mauna Loa Observatory, Hawaii, has risen dramatically since measurements began there. Graphic: Scripps Institution of Oceanography and NOAA Earth System Research Laboratory.
Is an athlete injecting steroids similar to industrial society’s emissions of greenhouse gases into the atmosphere? In each case, adding certain chemicals to a particular system (a human body, the Earth’s atmosphere) significantly increases that system’s capacity to reach extreme events more frequently.
Perhaps the most famous example of steroid use occurred from the mid-1990s to 2007 in major-league baseball. Remember Mark McGuire? After smashing home-run records in the late 1990s, he retired in fame and glory. But years later he confessed to having used steroids to increase his performance.
When McGuire was healthy during the first six years of his career, he had about 600 plate appearances and 33 home runs per year. Each time he came to the plate he had about a 1-in-18 likelihood of hitting a homer. But during 1996 to 1999, McGuire averaged 61 homers per year, raising his chances of hitting home runs to 1-in-10.
Using steroids allows athletes to build and repair muscle mass. It won’t allow a talented player to hit a homer every time at the plate. But in McGuire’s case, his steroid use allowed him to nearly double his likelihood of experiencing an extreme event—hitting a home run—whenever he batted.
Adding greenhouse gases to the atmosphere, meanwhile, increases humanity’s likelihood of experiencing extreme events such as floods and storms.
As the surface of the Earth warms, it stimulates evaporation from the oceans, lakes, and soils. The atmosphere, then, becomes warmer and moister, creating conditions for more frequent and extreme weather: storms, floods, and heat waves. Ice sheets are also melting faster as the Earth warms, raising global sea level, which is increasing the likelihood of coastal flooding.
So, is the steroid metaphor an effective one?
“Different stories connect with different people,” says Chris Field, a climate scientist at the Carnegie Institution and Stanford University. “And people like baseball.”
But a home run is not a risk, he says. The most important thing for the public to understand, he says, is that climate change increases the likelihood of extreme weather events.
A major flood is dangerous and potentially deadly. A hurricane destroys homes and damages communities. But the steroid/sports metaphor, Field says, lacks this element of risk. “A home run,” he adds, “is a good thing.”
Not if you’re the opposing pitcher.
Reading and Websites
Climate Change Impacts to Natural Resources in South Carolina. S.C. Department of Natural Resources.
Global Sea Level Rise Scenarios for the United States Climate Assessment. Silver Spring, MD: NOAA Climate Program Office, December 6, 2012.
Intergovernmental Panel on Climate Change
National Aeronautics and Space Administration Global Climate Change
National Flood Insurance Program
North Carolina Sea-Level Rise Assessment Report. North Carolina Coastal Resources Commission’s Science Panel on Coastal Hazards, March 2010.
South Carolina State Climatology Office
Third National Climate Assessment Report Final Draft for Public Comment. A report by the National Climate Assessment and Development Advisory Committee, January 2013.
Trenberth, Kevin E. “Framing the way to relate climate extremes to climate change.” Climatic Change, published online, March 21, 2012.
Tripati, Aradhna. “Coupling of CO2 and Ice Sheet Stability Over Major Climate Transitions of the Last 20 Million Years,” Science, published online, October 8, 2009.